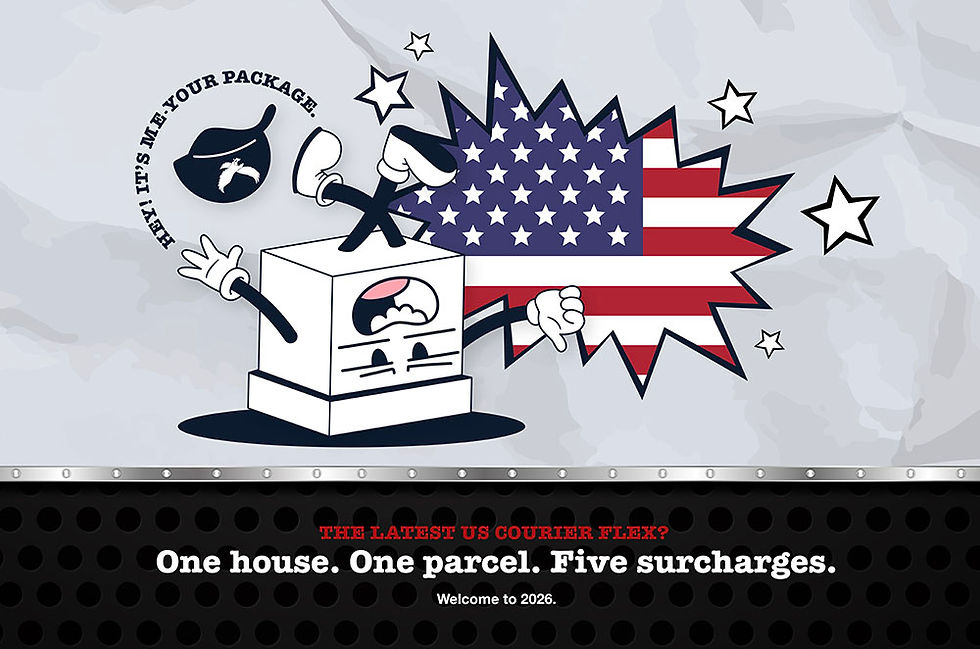
USPS $2.5 Billion Loss: The Logistics Warning Hiding Inside America’s Last Mile

USPS lost $2.5 billion in three months.
The Frightmare? That was an improvement.
Revenue went up. Costs were being squeezed. Work hours came down. Service performance improved. Shipping and Packages revenue grew. Management knocked $562 million off the loss recorded in the same quarter last year. And somehow, after all that good behaviour, another $2.5 billion still disappeared through the floorboards.
That is the part worth paying attention to.
Because this is not really a story about stamps. It is not even a story about USPS. It is a story about what happens when the economics underneath a logistics network stop matching the job that network is still expected to perform.
And if you run a large ecommerce business, retail network, distribution operation or parcel-heavy supply chain in the United States, that should make you slightly uncomfortable.
Because eventually, broken network economics become somebody else’s freight bill. Usually yours.

What the USPS $2.5 billion loss actually means
The USPS $2.5 billion loss landed in August 2026 looking like another ugly quarter in a very long collection of ugly quarters. Except the operating detail makes it considerably more interesting.
For the three months ended June 30, USPS reported $19.9 billion in operating revenue, up 6.1% year on year. Its controllable loss improved from $1.622 billion to $1.038 billion. Shipping and Packages revenue increased 7.7%. Management reduced four million work hours.
The overall net loss still came to $2.514 billion.
That is not what simple operational incompetence looks like. It is what happens when a business gets better at operating a network whose economics are still getting worse.
You can automate, optimise, cut labour hours, renegotiate transportation, increase prices and squeeze another few percentage points out of productivity. You can make the dashboard so green it starts photosynthesising. But if the architecture underneath the network no longer adds up, improvement only buys time.
That distinction matters far beyond USPS because supply chains rarely become dangerous when absolutely nothing works. Those failures are almost comforting. Everyone can see them. The nastier version is when every department can prove it improved while the system itself becomes harder to sustain.
That kind of failure can survive a dozen management meetings because everybody arrives carrying a KPI proving they did their job.
The most dangerous supply chain KPI might be “better than last year”
USPS lost $3.076 billion in the third quarter of fiscal 2025. A year later, it lost $2.514 billion. That is a $562 million improvement.
Both statements can be true at exactly the same time: performance improved, and the financial problem remains serious.
Supply chain reporting is remarkably uncomfortable holding those two ideas together. Businesses love comparisons. Freight cost down 4%. DIFOT up 2%. Claims down. Inventory accuracy improved. Cost per order slightly better. Excellent.
Compared with what?
A bad year? An obsolete network? A service target written before the customer changed? A budget assembled from old volumes, heroic assumptions and a spreadsheet that has somehow survived four restructures?
Improvement is not the same thing as adequacy.
“Better than last year” tells you direction. It does not tell you whether the destination still makes commercial sense. A business can improve every quarter on its way towards the wrong operating model.
USPS is simply demonstrating the principle at national scale.
The route does not care that your volume disappeared
USPS has a problem most commercial logistics businesses would back away from slowly. The network cannot simply follow profitable freight.
USPS is expected to serve more than 170 million addresses across the United States, six and often seven days a week, while generally relying on postal products and services to fund operations. Meanwhile, the economic engine historically helping support that enormous network has been shrinking underneath it.
First-Class Mail volume fell another 3.5% year on year in the third quarter of fiscal 2026. The U.S. Government Accountability Office has reported that USPS lost approximately $118 billion between fiscal 2007 and 2025 and has considered its financial viability high risk since 2009.
This creates what we call Density Debt.
Density Debt appears when the cost of maintaining a network survives long after the volume, mix or geography that justified it has changed. The route remains. The facility remains. The labour remains. The delivery point remains. The service expectation remains. The profitable piece that helped pay for all of it quietly leaves through the side door.
That is the poisonous mathematics of fixed-network logistics. A truck does not become 30% cheaper because it is 30% emptier. A warehouse does not lower the rent because forecast missed. A customer does not move six kilometres closer to the depot because demand softened.
Volume is allowed to disappear. Infrastructure is considerably less cooperative.
Reuters reported Postmaster General David Steiner saying that around 70% of USPS delivery routes lose money and 58% of its post offices are unprofitable. Steiner also put the cost associated with six-day delivery to roughly 170 million addresses at $3.4 billion annually.
You do not need 170 million addresses to create Density Debt. You just need a network designed for a business you no longer have.
Revenue is up. Volume is down. Everybody clap carefully.
There is another number buried inside the USPS results that deserves more attention than the headline loss.
Shipping and Packages revenue increased from $7.662 billion to $8.250 billion, or 7.7%. Shipping and Packages volume went the other way, falling from 1.609 billion to 1.554 billion pieces, or 3.4%.
Revenue up. Volume down. Wonderful material for a PowerPoint deck. Less wonderful when somebody asks the next question.
Based on those published figures, average Shipping and Packages revenue per piece increased from approximately $4.76 to $5.31, roughly 11.5%. That does not mean USPS simply raised prices by 11.5%. Service mix changed too, including continued Ground Advantage growth, while pricing also contributed to the increase.
But the pattern still matters.
We call it the Price-Volume Mirage.
The top line looks healthier. Revenue per piece rises. Someone circles the percentage in green. Meanwhile, fewer physical pieces are moving through the network.
That does not make pricing wrong. Pricing is supposed to recover cost. It does make one thing painfully clear: you cannot diagnose the health of a logistics network from revenue alone.
You need volume, mix, density, cost-to-serve, contribution by service, contribution by customer and contribution by geography. Preferably on the same page. Preferably without three teams arguing over whose spreadsheet is “the real one”.
USPS has the unusual inconvenience of publishing its version of this problem. Most businesses get to hide theirs inside blended freight rates for another six quarters.
You can raise the price of a bad equation. It is still the same equation.
USPS has increasingly relied on pricing alongside operational changes as it tries to restore financial sustainability. GAO has noted that USPS has raised prices, redesigned transportation and processing operations and received significant legislative relief, yet total expenses have continued to outpace total revenue.
That is where pricing becomes interesting.
Every network eventually reaches a point where it cannot keep charging its way out of structural cost without changing customer behaviour. Raise the price and revenue improves. Some volume leaves. Raise it again and the remaining volume carries more of the network.
Eventually pricing stops simply recovering cost and starts negotiating with demand.
That tension should be familiar to any supply chain team that has lived through enough freight tenders.
They ask, “How much more can we negotiate out of the rate?”
The better question is, “What is happening to the economic model that produced the rate?”
Those are not variations of the same question. One saves cents. The other spots the cliff.
Ecommerce was never going to magically rescue the economics
There has always been a seductively tidy story sitting around postal networks. Letters decline. Ecommerce grows. Packages replace letters. Problem solved.
Except the economics do not swap that neatly.
Shipping and Packages have become vastly more important to USPS, but more parcel revenue does not automatically replace the economics of the mail volume that disappeared. Brookings has noted that Shipping and Packages revenue grew from $10.3 billion in 2007 to $32.6 billion in 2025 while overall mail volume fell dramatically over the same period. The revenue mix changed. The structural financial problem remained.
That is why “more ecommerce” is not the answer by itself.
The question is whether parcel volume arrives with the density, yield, handling profile and contribution required to support the network carrying it.
That is a much less convenient question because it can ruin a very attractive growth story.
There is an old instinct in logistics that more volume eventually fixes the economics. Sometimes it does. Sometimes more volume simply gives an inefficient network the opportunity to lose money with considerably greater athleticism.
Follow the parcel far enough and the carrier logo starts lying to you
In May 2026, DHL eCommerce and USPS announced an exclusive multi-year U.S. last-mile delivery agreement expected to be worth more than $10 billion. DHL collects parcels, sorts them through 19 automated hubs and handles linehaul before USPS completes the final mile across its national delivery network.
That agreement matters for a reason much bigger than the contract value. It shows what parcel networks actually look like underneath the branding.
They overlap.
One company collects the parcel. Another moves it through final mile. Capacity is shared. Networks inject freight into other networks. Commercial services that look independent to the shipper can depend on the same infrastructure once the freight moves far enough downstream.
The logo on the tracking page creates a comforting illusion that you bought one network. Quite often, you bought an ecosystem wearing one logo.
That matters when one of the pieces underneath that ecosystem is financially strained. Not because USPS is about to disappear. There is no credible basis for saying that.
The risk is considerably less theatrical. The infrastructure keeps working. The economics underneath it change.
The headline is late. Your network should not be.
What should businesses actually be watching?
Another $2 billion USPS loss is not the thing businesses should be watching. By the time a number that large makes the headline, the interesting part has already happened underneath it.
The better signals are smaller and considerably less dramatic. Parcel volume falling while revenue rises. Pricing doing more of the heavy lifting. Low-density delivery becoming harder to justify. Carriers changing how they use USPS, where they inject freight, what they are prepared to carry and which parts of the country suddenly need a different commercial conversation.
That is where the future cost starts showing itself.
Because networks rarely wake up one morning and announce they have become uneconomic. They start behaving differently first. A service gets repriced. Capacity gets redirected. A postcode becomes awkward. A surcharge appears. A delivery promise gets quietly rewritten in the fine print.
Then everyone acts surprised when the invoice catches up.
The same suspicion needs to be turned on your own parcel network.
How much of your current delivery model only works because another organisation continues to absorb economics you do not control? How much of your free-shipping promise depends on last-mile capacity remaining cheap enough to keep subsidising it? How many of the carriers in your “diversified” portfolio ultimately lean on the same infrastructure once the parcel leaves your building?
Those are not carrier questions.
They are dependency questions.
And dependency is where apparently healthy logistics networks get caught pretending.
Three carrier contracts can look wonderfully diversified in a board pack. But if the same postal network, regional capacity or last-mile economics sit underneath all three, you have not necessarily spread the risk.
You have spread the paperwork.
The businesses that get caught will not be the ones with too few carrier logos. They will be the ones that never looked underneath them.
USPS loses the money first. That does not mean USPS pays for it last.
A $2.5 billion loss sounds comfortably like somebody else’s problem. Postal problem. Government problem. American problem. Something for USPS management, Congress and people who enjoy reading financial filings before breakfast. Except logistics costs have never been particularly respectful of organisational boundaries.
If the economics of a network serving more than 170 million addresses stop adding up, the answer cannot remain permanently trapped inside the network. Something eventually has to move. Price. Service. Capacity. Investment. Delivery frequency. Commercial terms. Usually several of them at once. And that is when the USPS problem starts quietly becoming everyone else’s problem.
Not in one spectacular hit. That would almost be easier. It arrives in pieces. A parcel rate moves. A surcharge appears. A service becomes less attractive. A carrier changes how it injects freight. A low-density postcode suddenly develops expensive tastes. Another provider adjusts its own pricing because the network underneath its service has changed. Operations reroutes around it. Procurement negotiates around it. Finance absorbs some of it. The customer gets handed whatever is left.
Nobody receives an invoice marked “USPS structural economics: your share.” They receive twenty smaller ones with different names.
That is why the headline loss is almost the least interesting number in the story. The real question is where the pressure goes next. Businesses only have a handful of places to put an increase in parcel economics. They can absorb it in margin. Put it into product price. Increase the delivery charge. Raise the free-shipping threshold. Slow the service promise. Change the carrier mix. Hold inventory somewhere else. Build another workaround and hope nobody calculates what the workaround costs.
Eventually, one of those decisions lands outside Logistics. Marketing is debating free shipping. Finance is questioning cost per order. Customer Service is managing delivery complaints. Operations has another carrier to control. IT has another integration. Inventory is sitting somewhere it did not sit before.
And everybody thinks they are solving a different problem.
They are not. They are watching the same logistics cost walk through the business wearing different clothes.
That is the flow-on effect worth watching from USPS. Not whether a parcel will still get delivered tomorrow. It almost certainly will. The bigger risk is that delivering it becomes progressively more expensive, more conditional and more complicated while customer expectations stubbornly refuse to become cheaper, slower or easier.
That gap has to be paid for somewhere.
USPS may be where the loss appears first. Your P&L may be where part of it eventually disappears.
How USPS network pressure can flow through to businesses
What changes upstream | What happens in the logistics network | What businesses may feel downstream | What it can become commercially |
USPS needs to recover more revenue | Pricing, service design and network economics come under pressure | Higher parcel rates, surcharges or altered service options | Lower margin, higher delivery charges or revised free-shipping thresholds |
Parcel volume falls while fixed network costs remain | Cost per delivery becomes harder to absorb across the network | Less attractive pricing on low-density, residential or difficult freight | Some customers, SKUs or regions become more expensive to serve |
Carriers change how they use USPS and other last-mile networks | Freight is reallocated, injected differently or shifted between providers | Changes to routing, service levels, capacity and delivery performance | More carrier management, more exceptions and more operational complexity |
Low-density delivery becomes more expensive | Providers become more selective about where and how they deploy capacity | Higher regional costs and greater variation between metropolitan and remote delivery economics | National pricing models begin hiding increasingly different cost-to-serve realities |
Businesses respond by adding carriers or services | The network gains more hand-offs, integrations and operating rules | More reconciliation, more systems, more exception management and more internal coordination | Freight savings can be replaced by Coordination Tax |
Businesses absorb increases rather than change the customer offer | Logistics cost quietly migrates into other parts of the P&L | Fulfilment cost per order increases without one obvious culprit | Profitability deteriorates while headline freight KPIs can still look acceptable |
Businesses pass increases to customers | Shipping thresholds, delivery charges or service promises change | Customers reconsider basket size, delivery speed or purchase decisions | A logistics cost problem becomes a pricing, conversion and retention problem |
Multiple providers rely on overlapping infrastructure | Apparent carrier diversification masks common dependencies | One network change can affect several supposedly separate carrier options | Supplier diversification turns out not to be network diversification |
Nobody fixes the cost. They hand it to the next person. USPS pushes on the carrier. The carrier pushes on the shipper. The shipper pushes on margin, price or service. Eventually somebody runs out of places to push.
Small logistics changes have a nasty habit of becoming business-model changes
The flow-on effect rarely arrives with sirens.
It starts politely.
A residential surcharge goes up. A zone becomes less attractive. A service level changes. A low-value parcel becomes harder to serve profitably. A carrier starts steering freight away from particular geographies. A “temporary” increase appears with the staying power of office furniture.
None of those things looks catastrophic on its own. That is precisely why they are dangerous.
Six months later, the free-shipping threshold has moved. Twelve months later, gross margin is thinner. The parcel mix has changed. More orders are being routed through a second carrier. Customer service is dealing with more delivery exceptions. Someone is holding additional inventory closer to demand to protect service. Another integration gets added. Another invoice needs reconciling. Another exception process becomes permanent.
Then finance asks the inevitable question.
Why is fulfilment cost per order still rising when we just completed another successful carrier tender?
Because the tender solved the rate.
It did not solve the economics underneath it.
That is the part businesses routinely miss. A logistics network can become more expensive without ever producing one spectacular cost increase. The pressure accumulates in small operational decisions until the business quietly starts changing around it.
The cheapest freight rate has a habit of turning up somewhere else
Procurement loves a clean number. Give everyone the same freight profile. Put the rates side by side. Argue over accessorials. Beat another few percent out of the incumbent. Highlight the winner. Job done.
Except freight rates are not products sitting on a supermarket shelf. They are symptoms of a network. Behind every apparently simple parcel rate is a mess of route density, labour, sortation, capacity, geography, service commitments, subcontractors, property, technology and other carriers doing jobs nobody mentions during the tender presentation.
And when any of that stops adding up, your “rate” does not remain politely untouched. It starts moving. The surcharge appears first because surcharges are excellent at entering a business without triggering an existential crisis. Then a service area changes. A cutoff gets earlier. Rural becomes expensive. Oversized becomes offensive. The carrier that spent eighteen months begging for your volume suddenly develops standards.
Operations works around it. Of course they do. That is what Operations does. They split the freight, add another carrier, move inventory, change routing logic and build another exception process. Customer Service gets told what to say. Finance gets told the increase has been contained. And somewhere in the building, the procurement saving is still sitting in a PowerPoint wearing a medal.
This is the bit businesses get wrong. They think they bought transportation at a cheaper rate. What they actually bought was access to a network whose economics they do not control.
If those economics deteriorate, the cost does not vanish because the contract says $8.42. It escapes into a surcharge, into inventory, into labour, into service failure, into expedited freight, into another provider, into another integration, into somebody spending Thursday afternoon reconciling invoices that were supposedly going to be automated.
The original freight rate can still look competitive while the business around it gets more expensive. That is why the cheapest carrier is sometimes only cheap at the moment you choose them.
Three months later, Operations knows. Six months later, Customer Service knows. Twelve months later, Finance knows. Procurement usually finds out when the tender comes around again.
Freight does not become expensive when the rate goes up. It becomes expensive when the business has to start bending around the rate it chose.
Your customer will never care who caused it
Your customer does not care that route density collapsed, that a carrier changed an injection point, that the regional service partner put its hand up for another increase or that the postcode they live in has suddenly become commercially offensive.
They bought from you.
You promised the price. You promised the delivery window. You put the little truck icon on the checkout page and confidently told them Tuesday.
As far as the customer is concerned, everybody upstream of that promise is your circus.
And when parcel economics start deteriorating, the circus gets expensive very quickly.
At first, Logistics absorbs it. A surcharge here. A service change there. A carrier quietly decides it no longer loves the freight it spent two years fighting to win. Operations patches around it because Operations is exceptionally good at keeping bad decisions alive long after everyone else has gone home.
Then the problem starts changing departments.
Marketing discovers the free-shipping threshold needs “reviewing”. Finance discovers cost per order has developed a drinking problem. Customer Service discovers another 400 people would quite like to know where their parcel is. IT gets asked for another carrier integration that apparently needs to be live yesterday. Inventory gets moved closer to customers because the network can no longer hit the promise from where it currently sits.
Everybody thinks they have a different problem.
They do not. They are all standing around the same parcel, arguing about which department owns the smoke.
That is the part businesses consistently underestimate. A last-mile cost increase does not stay politely inside Freight. It leaks into margin, conversion, working capital, customer service, technology, inventory and eventually brand.
By then, the original carrier increase is almost quaint.
The business has built an entire support structure around avoiding the consequence of one uncomfortable truth: the delivery promise no longer fits the economics underneath it.
And customers are spectacularly uninterested in the economics underneath anything.
They do not want to hear about carrier mix. They do not want a lesson in rural density. They do not care that Parcel Provider A handed the shipment to Network B, which injected it into Network C, which then discovered that Tuesday was apparently more of a suggestion.
They want the thing they ordered.
On the day you said.
For the price you showed them.
That is the whole contract in their head.
So when the network gets more expensive, the business eventually has to choose who gets disappointed.
Margin.
Marketing.
Operations.
Or the customer.
There is no version where everybody wins and Finance finds the extra money behind the couch.
That is why last-mile economics belong nowhere near a “freight only” conversation. The network can hand you a 70-cent problem and, six months later, Marketing is changing the checkout, Customer Service is hiring, Operations has added another carrier and Finance is wondering why the logistics budget appears to have reproduced overnight.
The carrier sends the increase. The customer sends the complaint. Your business pays for everything in between.
Three carriers can still leave you completely exposed
The comforting thing about a multi-carrier strategy is that it looks diversified from twenty feet away. Three providers. Three contracts. Three rate cards. Three escalation paths. Someone puts it into a board slide and the word “resilience” gets used with a straight face.
Then something moves underneath the network.
A shared last-mile dependency changes pricing. A regional capacity constraint bites. A postal injection point becomes less attractive. A subcontracted service changes terms. Suddenly two or three supposedly separate carrier options start behaving badly at exactly the same time.
That is when the diversification story gets awkward.
Because you can diversify the contracts and still concentrate the failure.
The risk is not that Carrier A, Carrier B and Carrier C all have the same logo. The risk is that, once the freight gets far enough downstream, all three may rely on the same infrastructure, the same geography, the same labour pool, the same postal reach or the same commercial economics nobody thought to map because the tender stopped at the account manager.
And when that shared dependency moves, your contingency plan can discover it was never really a contingency plan.
It was three versions of Plan A.
That is the part most carrier strategies miss. They model spend concentration beautifully. They know who has 40% of the volume, who has 30%, who has 20%, and who is being kept warm for peak.
What they often do not know is where those services become the same problem underneath the branding.
That is the number worth finding.
Not just who carries the parcel, but who touches it next. Where it gets injected. Which network finishes it. Which regions rely on shared capacity. Which services collapse back onto the same last-mile infrastructure when things get expensive. Which “backup” carrier quietly depends on the same operating conditions as the incumbent.
Because resilience is not having another carrier to call.
Resilience is knowing whether the second carrier still works when the first one stops working for the reason you actually care about. That distinction matters a lot more than the logo count.
A business can look beautifully diversified on paper and still have one ugly dependency sitting underneath the whole thing like a loose wheel nut.
Nobody notices it while everything is moving.
Then one upstream change hits three contracts at once and suddenly the “balanced carrier portfolio” turns into three account managers explaining the same problem with different PowerPoints.
If your three carriers all depend on the same road out, you do not have three exits.
The real danger is not the big increase. It is the accumulation.
Businesses rarely get taken out by one dramatic logistics event.
They get worn down by twenty small ones nobody thought were worth escalating.
A surcharge gets added. A minimum charge moves. A zone becomes less attractive. Peak pricing hangs around longer than expected. Another carrier is brought in to protect service. More inventory gets pushed closer to customers. Someone builds a workaround because the proper fix can wait until next quarter.
None of it looks dangerous.
That is why it survives.
Each decision is reasonable on its own. Each one has a business case. Each one gets approved because the alternative looks more disruptive.
Then somebody finally adds the whole thing up.
The freight rate might only be slightly worse. But now there are more carriers, more rules, more hand-offs, more reconciliations, more systems, more exceptions and more people required to keep the machine behaving.
The business thinks it absorbed a few increases. What it actually did was redesign itself around them. That is where logistics cost gets ugly.
Not when one line item explodes, but when the organisation slowly becomes more complicated just to preserve the same customer promise.
The carrier increase creates a routing change. The routing change creates an inventory decision. The inventory decision creates working-capital pressure. The new carrier creates another integration. The integration creates another exception queue. The exception queue creates another person.
Suddenly a parcel pricing problem has hired staff.
That is the flow-on effect businesses miss.
By the time logistics cost becomes large enough to get executive attention, the original increase is often the smallest part of the problem. The bigger cost is everything the business built around it.
Logistics rarely gets expensive in one move. It gets expensive one reasonable decision at a time.
Frequently asked questions about the USPS $2.5 billion loss
Why did USPS lose $2.5 billion if its revenue increased?
Because revenue growth does not automatically mean the economics underneath a logistics network are improving. USPS generated $19.9 billion in operating revenue in Q3 fiscal 2026, up 6.1% year on year, while still recording a $2.514 billion GAAP net loss. Its controllable loss improved by $584 million, yet USPS said its long-term liquidity crisis continued.
That is what makes the result more interesting than another ugly quarterly number. USPS got better at several things it could control and still lost billions. A network can improve operationally while remaining structurally expensive. That distinction matters well beyond postal services.
What does the USPS $2.5 billion loss mean for businesses?
The immediate lesson is not that businesses should expect USPS to stop delivering. The commercial risk is that sustained financial pressure eventually has to show up somewhere in the network economics.
That could mean changes in pricing, service structures, capacity decisions or commercial terms over time. USPS itself described its liquidity as precarious and said management actions alone would not solve problems created by its current business model and regulatory framework.
For shippers, the question is therefore not simply, “Will USPS still deliver our parcels?” It is what will it eventually cost the wider parcel ecosystem to keep delivering them?
Will USPS shipping prices increase because of its financial losses?
We cannot confirm that USPS will introduce any specific future price increase because of the Q3 2026 loss. USPS has, however, already used pricing as part of its financial response. Its Q3 results included a transportation-related temporary increase introduced on April 26, 2026 for certain Shipping and Packages products, and USPS said price increases contributed to revenue growth.
The bigger issue for businesses is not predicting the next increase. It is understanding how exposed the operation is if parcel economics move again. Waiting for the new rate card before modelling the consequence is not planning. It is opening the invoice slightly earlier.
Why does falling USPS package volume matter if package revenue is rising?
Because higher revenue can hide weaker underlying volume. USPS Shipping and Packages revenue rose 7.7% in Q3 fiscal 2026, from $7.662 billion to $8.250 billion, while volume fell 3.4%, from 1.609 billion to 1.554 billion pieces.
Transport Works calls this the Price-Volume Mirage. Revenue per piece can improve while fewer pieces move through the network. That does not make pricing wrong, but it does make revenue a dangerous metric to read by itself. A healthy-looking top line can hide changing demand, density, service mix and cost-to-serve underneath it.
What is Density Debt in logistics?
Density Debt is the cost created when a logistics network keeps carrying infrastructure designed for volume, mix or geography that has already changed. The routes remain. Facilities remain. Labour remains. Delivery points remain. The volume that once helped pay for all of it does not necessarily stay.
That is why declining volume can hurt far more than the percentage suggests. A delivery route does not become proportionally cheaper because fewer parcels are riding on it. Volume can disappear overnight. Infrastructure generally wants notice, a business case and eighteen months.
Can USPS financial pressure affect other parcel carriers?
Yes, USPS matters beyond shipments carrying a USPS label because parcel networks can depend on one another. In May 2026, DHL eCommerce and USPS announced an exclusive multi-year U.S. last-mile agreement expected to be worth more than $10 billion. DHL handles first- and middle-mile activity before USPS performs final-mile delivery through its national network.
That is a useful reminder for shippers: different carrier logos do not always mean completely independent infrastructure. Follow the parcel far enough and apparently separate networks can start sharing the same plumbing.
Does using multiple parcel carriers eliminate supply chain risk?
No. Multiple carrier contracts can reduce supplier concentration without necessarily eliminating underlying network concentration.
A business can spread volume across several providers while those services still depend on overlapping last-mile infrastructure, regional capacity or common network economics. The USPS-DHL relationship is a clear example of how one branded service can use another organisation’s delivery network underneath it.
Three carrier logos can absolutely provide options. But if all three ultimately depend on the same road out, you do not have three exits.
Could USPS financial pressure affect ecommerce margins and free shipping?
Potentially, yes, although we cannot confirm that the Q3 USPS loss will directly cause any individual retailer to change its free-shipping model.
The commercial mechanism is straightforward. If parcel delivery becomes more expensive, businesses eventually have to absorb the cost in margin, recover it through product or delivery pricing, change shipping thresholds, alter service promises or redesign fulfilment. USPS has already reported higher Shipping and Packages revenue alongside lower package volume and has described its liquidity position as precarious.
That is why parcel economics eventually stop being a Logistics conversation. A delivery-cost problem can walk into Marketing, Finance and Customer Experience before anyone remembers where it started.
What should businesses monitor after the USPS $2.5 billion loss?
Do not wait for the next multi-billion-dollar headline. The useful warning signs appear before the headline does.
Watch Shipping and Packages volume against revenue. Watch pricing and surcharges. Watch low-density and residential delivery economics. Watch changes in carrier injection arrangements, service standards and capacity appetite. And look underneath your own carrier portfolio to understand where supposedly different providers share infrastructure.
GAO has considered USPS financial viability a high-risk issue since 2009 and reported approximately $118 billion in USPS net losses from fiscal 2007 through 2025.
The number to watch is not simply the next USPS loss.
Watch what the network starts doing differently before the loss arrives.
Is USPS going bankrupt or shutting down?
There is no credible evidence that USPS is currently shutting down, and “bankruptcy” is not a useful way to describe its position as though it were an ordinary commercial parcel company. USPS is an independent federal establishment with a statutory mission to serve more than 170 million U.S. addresses, generally funding operating expenses through postage, products and services.
Its financial condition is nevertheless serious. USPS described its liquidity as precarious in August 2026, while GAO has classified its financial viability as high risk since 2009.
So the useful business question is not “Will USPS disappear?”
It is “What has to change to keep a network this important economically sustainable?”
The USPS $2.5 billion loss is not really about USPS
There is one reason this story should bother experienced supply chain leaders more than another dramatic logistics failure would.
The network is still working.
Packages are moving. Revenue increased. Shipping and Packages revenue grew. Management reduced work hours. The quarterly loss improved by more than half a billion dollars. USPS signed a last-mile agreement with DHL worth more than $10 billion.
And the underlying financial problem remains serious.
That is what makes this useful.
Failure rarely arrives carrying a sign announcing that the operating model has expired. It arrives as individually defensible decisions. Raise the price. Cut the hours. Optimise the route. Add the surcharge. Change the service. Protect the quarter. Build the workaround.
Repeat.
Eventually somebody zooms out far enough to discover the organisation has spent years becoming better at operating a model that no longer adds up.
USPS gets to discover that contradiction in public.
Most businesses discover theirs privately. Usually during budget season. Usually after the customer promise has already been made. Usually after the network has become expensive to change.
The $2.5 billion is not the warning.
The warning is that revenue can rise, productivity can improve, rates can increase, new contracts can be won and individual KPIs can all move in the right direction while the economics underneath the network continue moving the other way.
That is when optimisation stops being enough.
Because the question is no longer whether the pieces are performing.
It is whether the architecture they are performing inside still deserves to exist.
Transport Works. Because Your Supply Chain Won’t Fix Itself.
Want to know what else is changing underneath America’s logistics network? Read:
THE THINKING BEHIND THE LAST MILE
THE NETWORK IS BIGGER THAN ONE ZIP CODE. SO ARE WE.
INSIGHTS FROM DANYUL GLEESON, FOUNDER, CLUSTER-FREIGHT-FIXER & LOGISTICS CHAOS TAMER-IN-CHIEF AT TRANSPORT WORKS
Danyul has been in the trenches - warehouses where pick paths were sketched on pizza boxes and boardrooms where the “supply chain strategy” was a shrug. He built Transport Works to flip that script: a 4PL that turns broken systems into competitive advantage. His mission? Always Delivering - without the chaos.
Sources & References
USPS Financial Results, Revenue and Parcel Volume
United States Postal Service (USPS) – U.S. Postal Service Reports Third Quarter Fiscal Year 2026 Results
Used as the primary source for the USPS $2.514 billion Q3 FY2026 net loss, $19.9 billion operating revenue, 6.1% year-on-year revenue growth, $584 million improvement in controllable loss, four million work-hour reduction and USPS’s statement that its long-term liquidity crisis remains severe. It also supports the Shipping and Packages figures used throughout the article: revenue rising 7.7% from $7.662 billion to $8.250 billion while volume fell 3.4% from 1.609 billion to 1.554 billion pieces. These figures underpin the article’s Price-Volume Mirage analysis.
United States Postal Service (USPS) – U.S. Postal Service Reports Fiscal Year 2025 Results
Referenced for FY2025 financial context, including USPS operating revenue, its $9.0 billion annual net loss, transportation expense reductions and the continuing divergence between Shipping and Packages revenue and volume. Used to demonstrate that improving revenue and operational efficiency have not, by themselves, resolved the underlying financial model.
United States Postal Service (USPS) – Remarks by Postmaster General David Steiner at the Aug. 7, 2026, USPS Board of Governors Meeting
Used to support the article’s interpretation that operational improvement and financial sustainability can move in opposite directions. Steiner reported improving service, lower work hours and better financial performance while simultaneously describing an urgent financial crisis and arguing that USPS must be considered within the much larger economic ecosystem that depends upon it.
USPS Financial Sustainability, Fixed Costs and Network Economics
U.S. Government Accountability Office (GAO) – U.S. Postal Service: Action Needed to Fix Unsustainable Business Model
Used to support the long-term financial context behind the article, including USPS’s continued losses despite price increases, transportation and processing network redesign, operational changes and legislative relief. GAO has classified USPS financial viability as a High Risk issue since 2009 and concludes that its existing business model remains unsustainable without further USPS and congressional action.
U.S. Government Accountability Office (GAO) – U.S. Postal Service: Urgent Action Needed to Fix Poor Financial Condition
Referenced for USPS’s deteriorating financial position, its attempts to increase revenue and reduce expenses, and GAO’s conclusion that the scale of the problem requires changes beyond operational cost reduction alone. This supports the article’s central argument that cutting harder cannot repair architecture that no longer matches the economics underneath it.
Reuters – US Postal Service Reports $2.5 Billion Quarterly Loss
Used for independent reporting on the August 2026 results and Postmaster General David Steiner’s comments that approximately 70% of USPS delivery routes lose money, 58% of post offices are unprofitable, and six-day delivery across roughly 170 million addresses carries an estimated annual cost of $3.4 billion. These figures support the article’s Density Debt framing and its examination of fixed-network economics.
Ecommerce, Changing Mail Economics and the Price-Volume Shift
Brookings Institution – The U.S. Postal Service’s Fiscal Crisis
Referenced for historical changes in the USPS revenue mix. Brookings reports that Shipping and Packages revenue increased from approximately $10.3 billion in 2007 to $32.6 billion in 2025, while overall mail volume fell sharply over the same period. Used to support the article’s argument that ecommerce and parcel growth have transformed USPS revenue without automatically repairing the economics lost through declining traditional mail volumes.
Last-Mile Delivery, Carrier Dependency and Network Concentration
DHL eCommerce / United States Postal Service – DHL eCommerce and USPS Enter $10 Billion-Plus, Long-Term Exclusive Agreement
Used to support the article’s analysis of interconnected parcel networks and hidden infrastructure dependencies. Under the agreement, DHL eCommerce performs nationwide pickup, sortation through 19 automated hubs and linehaul before USPS completes final-mile delivery through its network reaching more than 170 million delivery points. The agreement is expected to be worth more than $10 billion and demonstrates why apparently separate carrier services can depend on shared underlying infrastructure.
Independent Reporting on the Wider USPS Financial Crisis
Reuters – US Postal Service Tells Congress It Needs Help, Running Out of Cash
Referenced for wider context on USPS liquidity pressure, the structural cost of universal delivery and Postmaster General David Steiner’s requests for congressional reform. Used to reinforce the distinction between a temporary quarterly loss and the much larger structural issue surrounding the economics of maintaining nationwide postal infrastructure.
Reuters – US Postal Service Halts Non-Essential Spending as Cash Crisis Deepens
Used to support discussion of USPS cash-conservation measures, including suspended non-essential spending and pension-related payment measures, as well as the growing tension between financial sustainability, pricing, service and nationwide network obligations.
Additional Regulatory and Industry Context
Postal Regulatory Commission (PRC) – Analysis of the Postal Service’s FY 2025 Annual Performance Report and FY 2026 Performance Plan
Referenced as additional regulatory context for USPS revenue, controllable expenses and Shipping and Packages performance. The PRC data provides independent support for the changing economics of USPS package revenue, transportation expenses and the organisation’s continuing attempt to grow competitive parcel services while maintaining its national network.
Disclaimer:
The information in this blog is provided for general informational purposes only and is current as of the date of publication. Customs duties, charges, processes, policies, and rates are subject to change at any time without notice. We make no representations or warranties of any kind, express or implied, about the completeness, accuracy, reliability, suitability, or availability of the information contained in this article. You should not rely on this content as a substitute for official sources. For the most up-to-date and authoritative information, please consult the relevant government agencies, customs authorities, and reference websites directly. Ideas, interpretations, and opinions expressed here are subject to change as regulations, markets, and industry practices evolve. Transport Works and its authors accept no liability for any loss or damage whatsoever arising from reliance on the information in this blog.